ZERO-ORDER VS FIRST-ORDER DEGRADATION
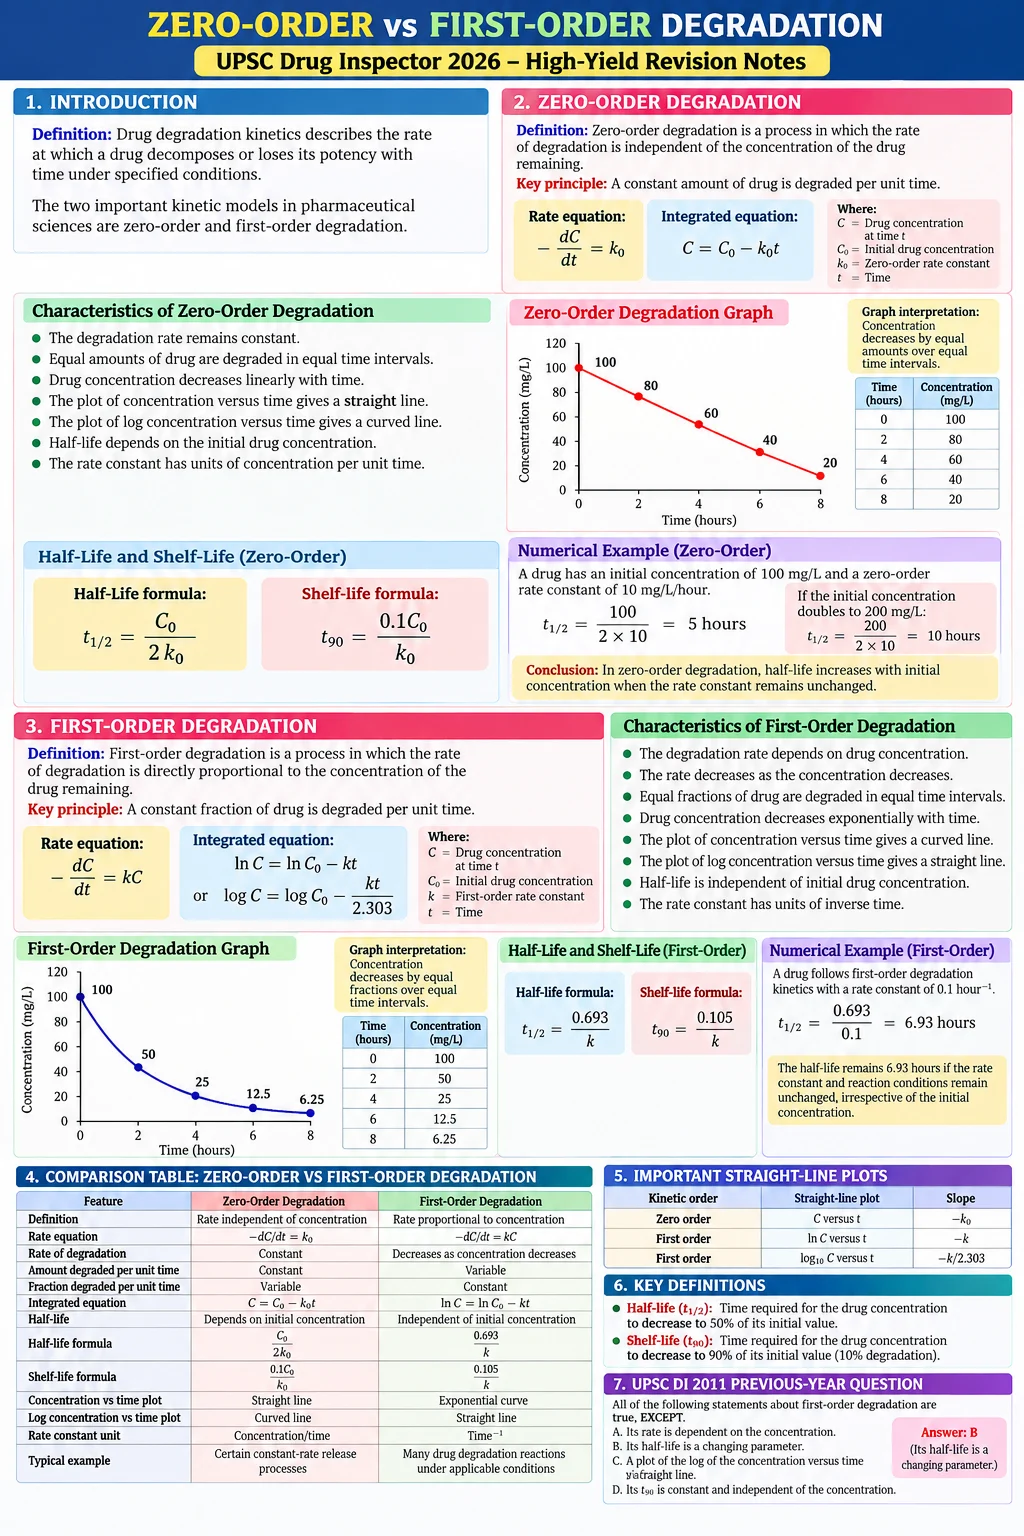
ZERO-ORDER VS FIRST-ORDER DEGRADATION
UPSC Drug Inspector 2026 — High-Yield Revision Notes
1. Introduction
Definition: Drug degradation kinetics describes the rate at which a drug decomposes or loses its potency with time under specified conditions.
The two important kinetic models in pharmaceutical sciences are zero-order and first-order degradation.
2. Zero-Order Degradation
Definition: Zero-order degradation is a process in which the rate of degradation is independent of the concentration of the drug remaining.
Key principle: A constant amount of drug is degraded per unit time.
Rate equation
−dCdt = k0
Integrated equation
C = C0 − k0t
Where
- C = Drug concentration at time t
- C0 = Initial drug concentration
- k0 = Zero-order rate constant
- t = Time
Characteristics of Zero-Order Degradation
- The degradation rate remains constant.
- Equal amounts of drug are degraded in equal time intervals.
- Drug concentration decreases linearly with time.
- The plot of concentration versus time gives a straight line.
- The plot of log concentration versus time gives a curved line.
- Half-life depends on the initial drug concentration.
- The rate constant has units of concentration per unit time.
Zero-Order Degradation Graph

Reference graph: Zero-order concentration-versus-time graph (PNG)
Graph interpretation: The concentration decreases by equal amounts over equal time intervals.
| Time (hours) | Concentration (mg/L) |
|---|---|
| 0 | 100 |
| 2 | 80 |
| 4 | 60 |
| 6 | 40 |
| 8 | 20 |
The concentration decreases by 20 mg/L every 2 hours.
Exam point: Concentration versus time gives a straight line with slope −k0.
Half-Life Formula
t1/2 = C02k0
Shelf-Life Formula
t90 = 0.1C0k0
Numerical Example
A drug has an initial concentration of 100 mg/L and a zero-order degradation rate constant of 10 mg/L/hour.
t1/2 = 1002 × 10
t1/2 = 5 hours
If the initial concentration doubles to 200 mg/L
t1/2 = 2002 × 10 = 10 hours
Conclusion: In zero-order degradation, half-life increases with initial concentration when the rate constant remains unchanged.
3. First-Order Degradation
Definition: First-order degradation is a process in which the rate of degradation is directly proportional to the concentration of the drug remaining.
Key principle: A constant fraction of drug is degraded per unit time.
Rate equation
−dCdt = kC
Integrated equation
ln C = ln C0 − kt
Alternatively
log C = log C0 − kt2.303
Where
- C = Drug concentration at time t
- C0 = Initial drug concentration
- k = First-order rate constant
- t = Time
Characteristics of First-Order Degradation
- The degradation rate depends on drug concentration.
- The rate decreases as the concentration decreases.
- Equal fractions of drug are degraded in equal time intervals.
- Drug concentration decreases exponentially with time.
- The plot of concentration versus time gives a curved line.
- The plot of log concentration versus time gives a straight line.
- Half-life is independent of initial drug concentration.
- The rate constant has units of inverse time.
First-Order Degradation Graph

Reference graph: First-order concentration-versus-time graph (PNG)
Graph interpretation: The concentration decreases by equal fractions over equal time intervals.
Illustrative data when half-life is 2 hours
| Time (hours) | Concentration (mg/L) |
|---|---|
| 0 | 100 |
| 2 | 50 |
| 4 | 25 |
| 6 | 12.5 |
| 8 | 6.25 |
The concentration decreases by 50% every 2 hours.
Exam point: Log concentration versus time gives a straight line with slope −k when natural logarithms are used.
Half-Life Formula
t1/2 = 0.693k
Shelf-Life Formula
t90 = 0.105k
Numerical Example
A drug follows first-order degradation kinetics with a rate constant of 0.1 hour−1.
t1/2 = 0.6930.1
t1/2 = 6.93 hours
The half-life remains 6.93 hours if the rate constant and reaction conditions remain unchanged, regardless of the initial concentration.
4. Comparison Table: Zero-Order vs First-Order Degradation
| Feature | Zero-Order Degradation | First-Order Degradation |
|---|---|---|
| Definition | Rate independent of concentration | Rate proportional to concentration |
| Rate equation | −dC/dt = k0 | −dC/dt = kC |
| Rate of degradation | Constant | Decreases as concentration decreases |
| Amount degraded per unit time | Constant | Variable |
| Fraction degraded per unit time | Variable | Constant |
| Integrated equation | C = C0 − k0t | ln C = ln C0 − kt |
| Half-life | Depends on initial concentration | Independent of initial concentration |
| Half-life formula | C0/(2k0) | 0.693/k |
| Shelf-life formula | 0.1C0/k0 | 0.105/k |
| Concentration vs time plot | Straight line | Exponential curve |
| Log concentration vs time plot | Curved line | Straight line |
| Rate constant unit | Concentration/time | Time⁻¹ |
| Typical example | Certain constant-rate release processes | Many drug degradation reactions under applicable conditions |
5. Important Straight-Line Plots
| Kinetic order | Straight-line plot | Slope |
|---|---|---|
| Zero order | C versus t | −k0 |
| First order | ln C versus t | −k |
| First order | log 10C versus t | −k/2.303 |
Reference graphs
- Zero-order degradation graph (PNG)
- First-order degradation graph (PNG)
6. Half-Life and Shelf-Life
Half-life (t1/2): The time required for the drug concentration to decrease to 50% of its initial value.
Shelf-life (t90): The time required for the drug concentration to decrease to 90% of its initial value, corresponding to 10% degradation.
| Parameter | Zero Order | First Order |
|---|---|---|
| Half-life | C0/(2k0) | 0.693/k |
| Shelf-life | 0.1C0/k0 | 0.105/k |
| Dependence on initial concentration | Yes | No |
These formulas assume that the stated kinetic model applies and the rate constant remains unchanged.
7. Numerical Questions
Example 1: First-Order Half-Life
A drug has a first-order rate constant of 0.2 hour−1. Calculate its half-life.
Formula
t1/2 = 0.693k
Calculation
t1/2 = 0.6930.2
t1/2 = 3.465 hours
Example 2: Zero-Order Half-Life
A drug has an initial concentration of 80 mg/L and a zero-order rate constant of 8 mg/L/hour. Calculate its half-life.
Formula
t1/2 = C02k0
Calculation
t1/2 = 802 × 8
t1/2 = 5 hours
Example 3: First-Order Shelf-Life
A drug has a first-order rate constant of 0.05 hour−1. Calculate its shelf-life.
Formula
t90 = 0.105k
Calculation
t90 = 0.1050.05
t90 = 2.1 hours
8. UPSC DI 2011 Previous-Year Question
Q. All of the following statements about first-order degradation are true, EXCEPT.
- Its rate is dependent on the concentration.
- Its half-life is a changing parameter.
- A plot of the log of concentration versus time yields a straight line.
- Its t90 is constant and independent of the concentration.
Correct Answer: B. Its half-life is a changing parameter.
Explanation: First-order degradation has a constant half-life that is independent of the initial drug concentration. Its rate depends on concentration, and both half-life and t90 remain constant when the rate constant and reaction conditions remain unchanged.
9. Exam Memory Tricks
- Zero order: Constant amount degraded per unit time.
- First order: Constant fraction degraded per unit time.
- Zero-order half-life: Depends on initial concentration.
- First-order half-life: Independent of initial concentration.
- Zero-order straight-line plot: Concentration versus time.
- First-order straight-line plot: Log concentration versus time.
- Zero-order rate constant: Concentration/time.
- First-order rate constant: Time⁻¹.
- First-order half-life: 0.693/k.
- First-order shelf-life: 0.105/k.
10. One-Minute Final Revision
| Remember | Zero Order | First Order |
|---|---|---|
| Rate depends on concentration | No | Yes |
| Amount lost per unit time | Constant | Variable |
| Fraction lost per unit time | Variable | Constant |
| Half-life | Depends on C0 | Independent of C0 |
| Straight-line plot | C versus t | Log C versus t |
| Rate constant | k0 | k |
Most important exam trap: Do not confuse half-life with shelf-life. For first-order degradation, t90 = 0.105/k; for zero-order degradation, t90 = 0.1C0/k0.
UPSC DI takeaway: If a question states that half-life changes with initial drug concentration, the behaviour is consistent with zero-order rather than first-order kinetics.
11. References for Further Study
- Aulton’s Pharmaceutics: The Design and Manufacture of Medicines — pharmaceutical stability and degradation kinetics.
- Lachman, Lieberman and Kanig: The Theory and Practice of Industrial Pharmacy — pharmaceutical stability.
- Martin’s Physical Pharmacy and Pharmaceutical Sciences — reaction kinetics and pharmaceutical stability.
- Relevant pharmaceutical analysis and physical pharmacy textbooks prescribed by the university.
🎯 Exam Tip: The graphs and numerical examples are illustrative teaching materials. For examination questions, use the kinetic model and conditions stated in the question.